
Production · January 18, 2026 · 5 min read
Egg production tracking that managers actually use
From trays per house to hen-day percentage — building a production dashboard your team trusts.
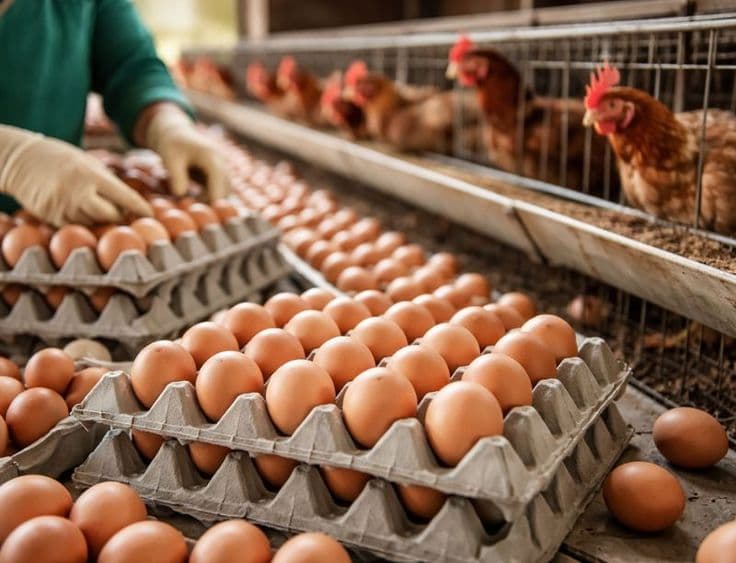
Layer operations generate production data every day: eggs collected, cracked, dirty, and floor eggs. When collection is logged by house and shift, you can calculate hen-day production, case weight trends, and revenue per bird in real time.
Capture at collection point
The most reliable data is entered where work happens — on the tablet in the egg room, not transcribed later in the office. Simple forms per house with validation (total eggs can't exceed bird count) prevent garbage in, garbage out.
Track quality grades
Separating saleable, second grade, and reject eggs affects revenue forecasting. Grade mix trends often signal shell quality issues, nutrition imbalances, or stress before they hit your customer complaints.
Benchmark against peak production
Plot current hen-day percentage against breed curves and your farm's best historical batches. A slow decline after peak might be normal aging — a sharp drop warrants a flock health review.